Project Overview
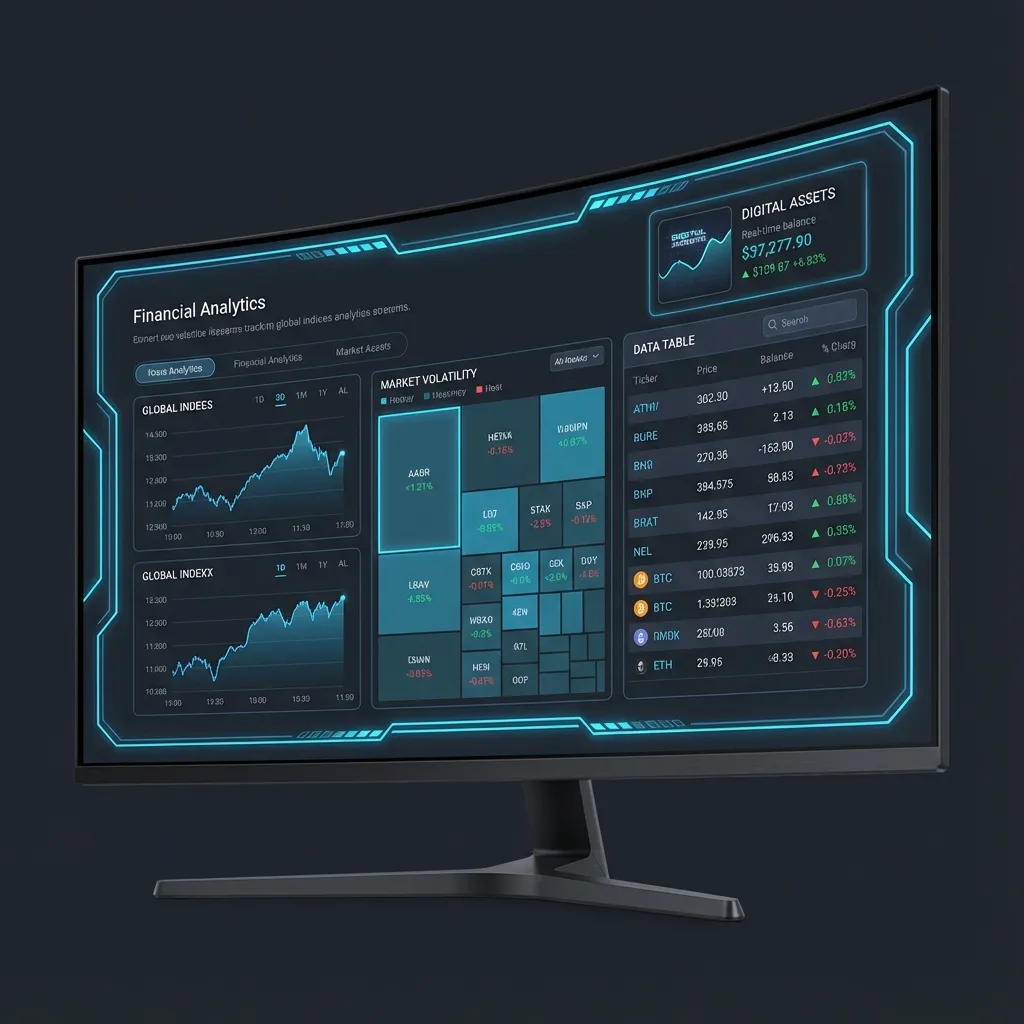
In the fast-paced world of finance, data is only as valuable as the speed at which it can be understood. The FinTech Analytics Dashboard is a concept built to solve the problem of information overload. It takes streams of raw market data and converts them into intuitive, real-time visualizations that allow traders to spot trends instantly.
The goal was to build a dashboard that feels less like a spreadsheet and more like a cockpit. I wanted to move away from static tables and leverage the power of vector graphics (SVG) to create dynamic charts that update live without refreshing the page.
The Challenge
Data Density vs. Performance: Rendering thousands of data points on a screen is expensive. A standard DOM-based charting library would choke under the weight of real-time updates. If we have 50 tickers updating every second, that's hundreds of DOM reflows per minute.
Responsiveness: Financial dashboards are notorious for being desktop-only. Making a complex heatmap or candlestick chart work on a mobile screen required a complete rethinking of the layout and interaction patterns.
Technical Solution
I chose D3.js (Data-Driven Documents) integrated with React for the visualization layer. While React handles the component lifecycle and state management, D3 handles the heavy lifting of calculating SVG paths and scales.
- Hybrid Rendering: For static elements like axes and labels, I used standard React components. For the fast-moving data lines, I used D3 to manipulate the SVGs directly, bypassing some of React's reconciliation overhead for maximum frame rate.
- Socket Simulation: To mimic a real trading environment, I built a lightweight data generator that mimics market volatility (Random Walks). This data is pushed to the frontend via an observer pattern, ensuring the UI stays decoupled from the data source.
- Memoization: Heavy usage of `useMemo` and `useCallback` ensures that expensive chart calculations (like min/max scaling) only run when new data actually arrives, not on every re-render.
Results & Impact
The resulting dashboard is capable of rendering 60fps updates even on mid-range devices. It demonstrates mastery over complex state management and the ability to integrate imperative libraries (like D3) into declarative frameworks (like React), a common requirement in high-level comprehensive engineering roles.